
MIDUS Data Timelines
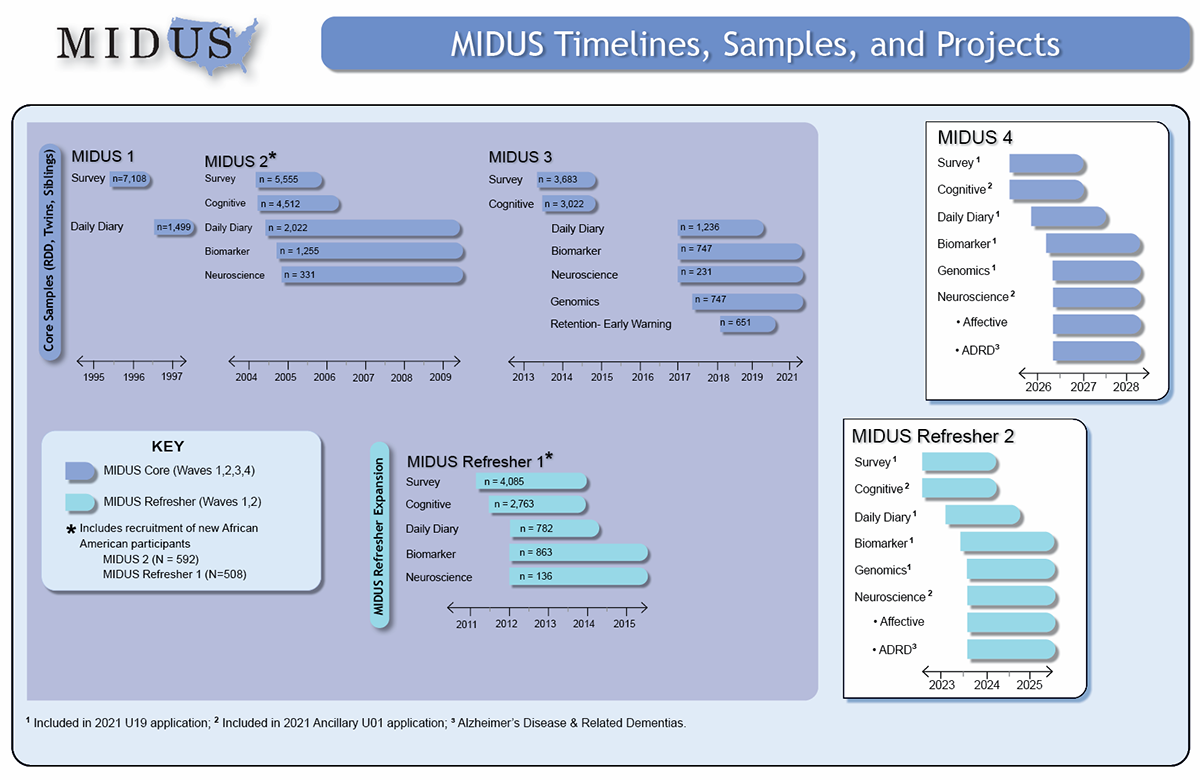
The graph below represents the samples and all of the extant, ongoing, and planned data collection events for MIDUS since its inception. The numbers within each bar indicate the sample size for that particular event. Note too that the graph includes the Japanese component of MIDUS called MIDJA (Midlife in Japan).
©2022 University of Wisconsin - Madison, Institute on Aging